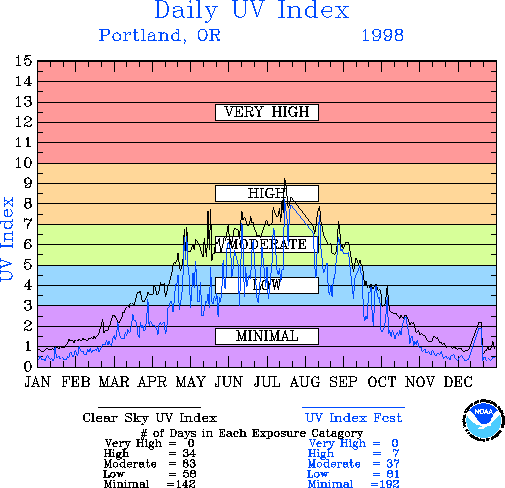
How does today's UV Index compare with other days in Oregon? Let's see how many days had very-high, high, moderate, low, and minimal ratings. (You may want to print a copy of this activity.)
First, read the information about the UV Index Annual Time Series.
Now, follow the link to the Oregon data for 1998.
You will see a colorful graph. At first glance, you see that in 1998 there were no days when the UV Index Forecast was "very high" for Portland, Oregon. (That should come as no surprise to residents!) You will also see that there is some variation between the "Clear Sky UV Index data (black line) and the UV Index Fcts (Forecast&emdash;blue line). We will be using the summary information about the UV Index Fcst (Forecast). It appears at the bottom right of the graph, and it looks like this for 1998:
Very High =